Airbnb in Cascais' Region
In this analysis the following questions will be addressed:
- Who is booking Airbnb rooms in Cascais? (Profiling)
- Where do they choose to stay? (Geographic analysis)
- When do they do it? (Time Series analysis)
All the data was provided by Nova School of Business and Economics' research centre: Data Science for Social Impact and Management.
This analysis is focused on Smart Tourism Management in Portugal and was developed for Turismo de Portugal, a public national institution responsible for the promotion, enrichment and sustainability of Tourism in the country.
Analysis of All Datasets
Property Listings
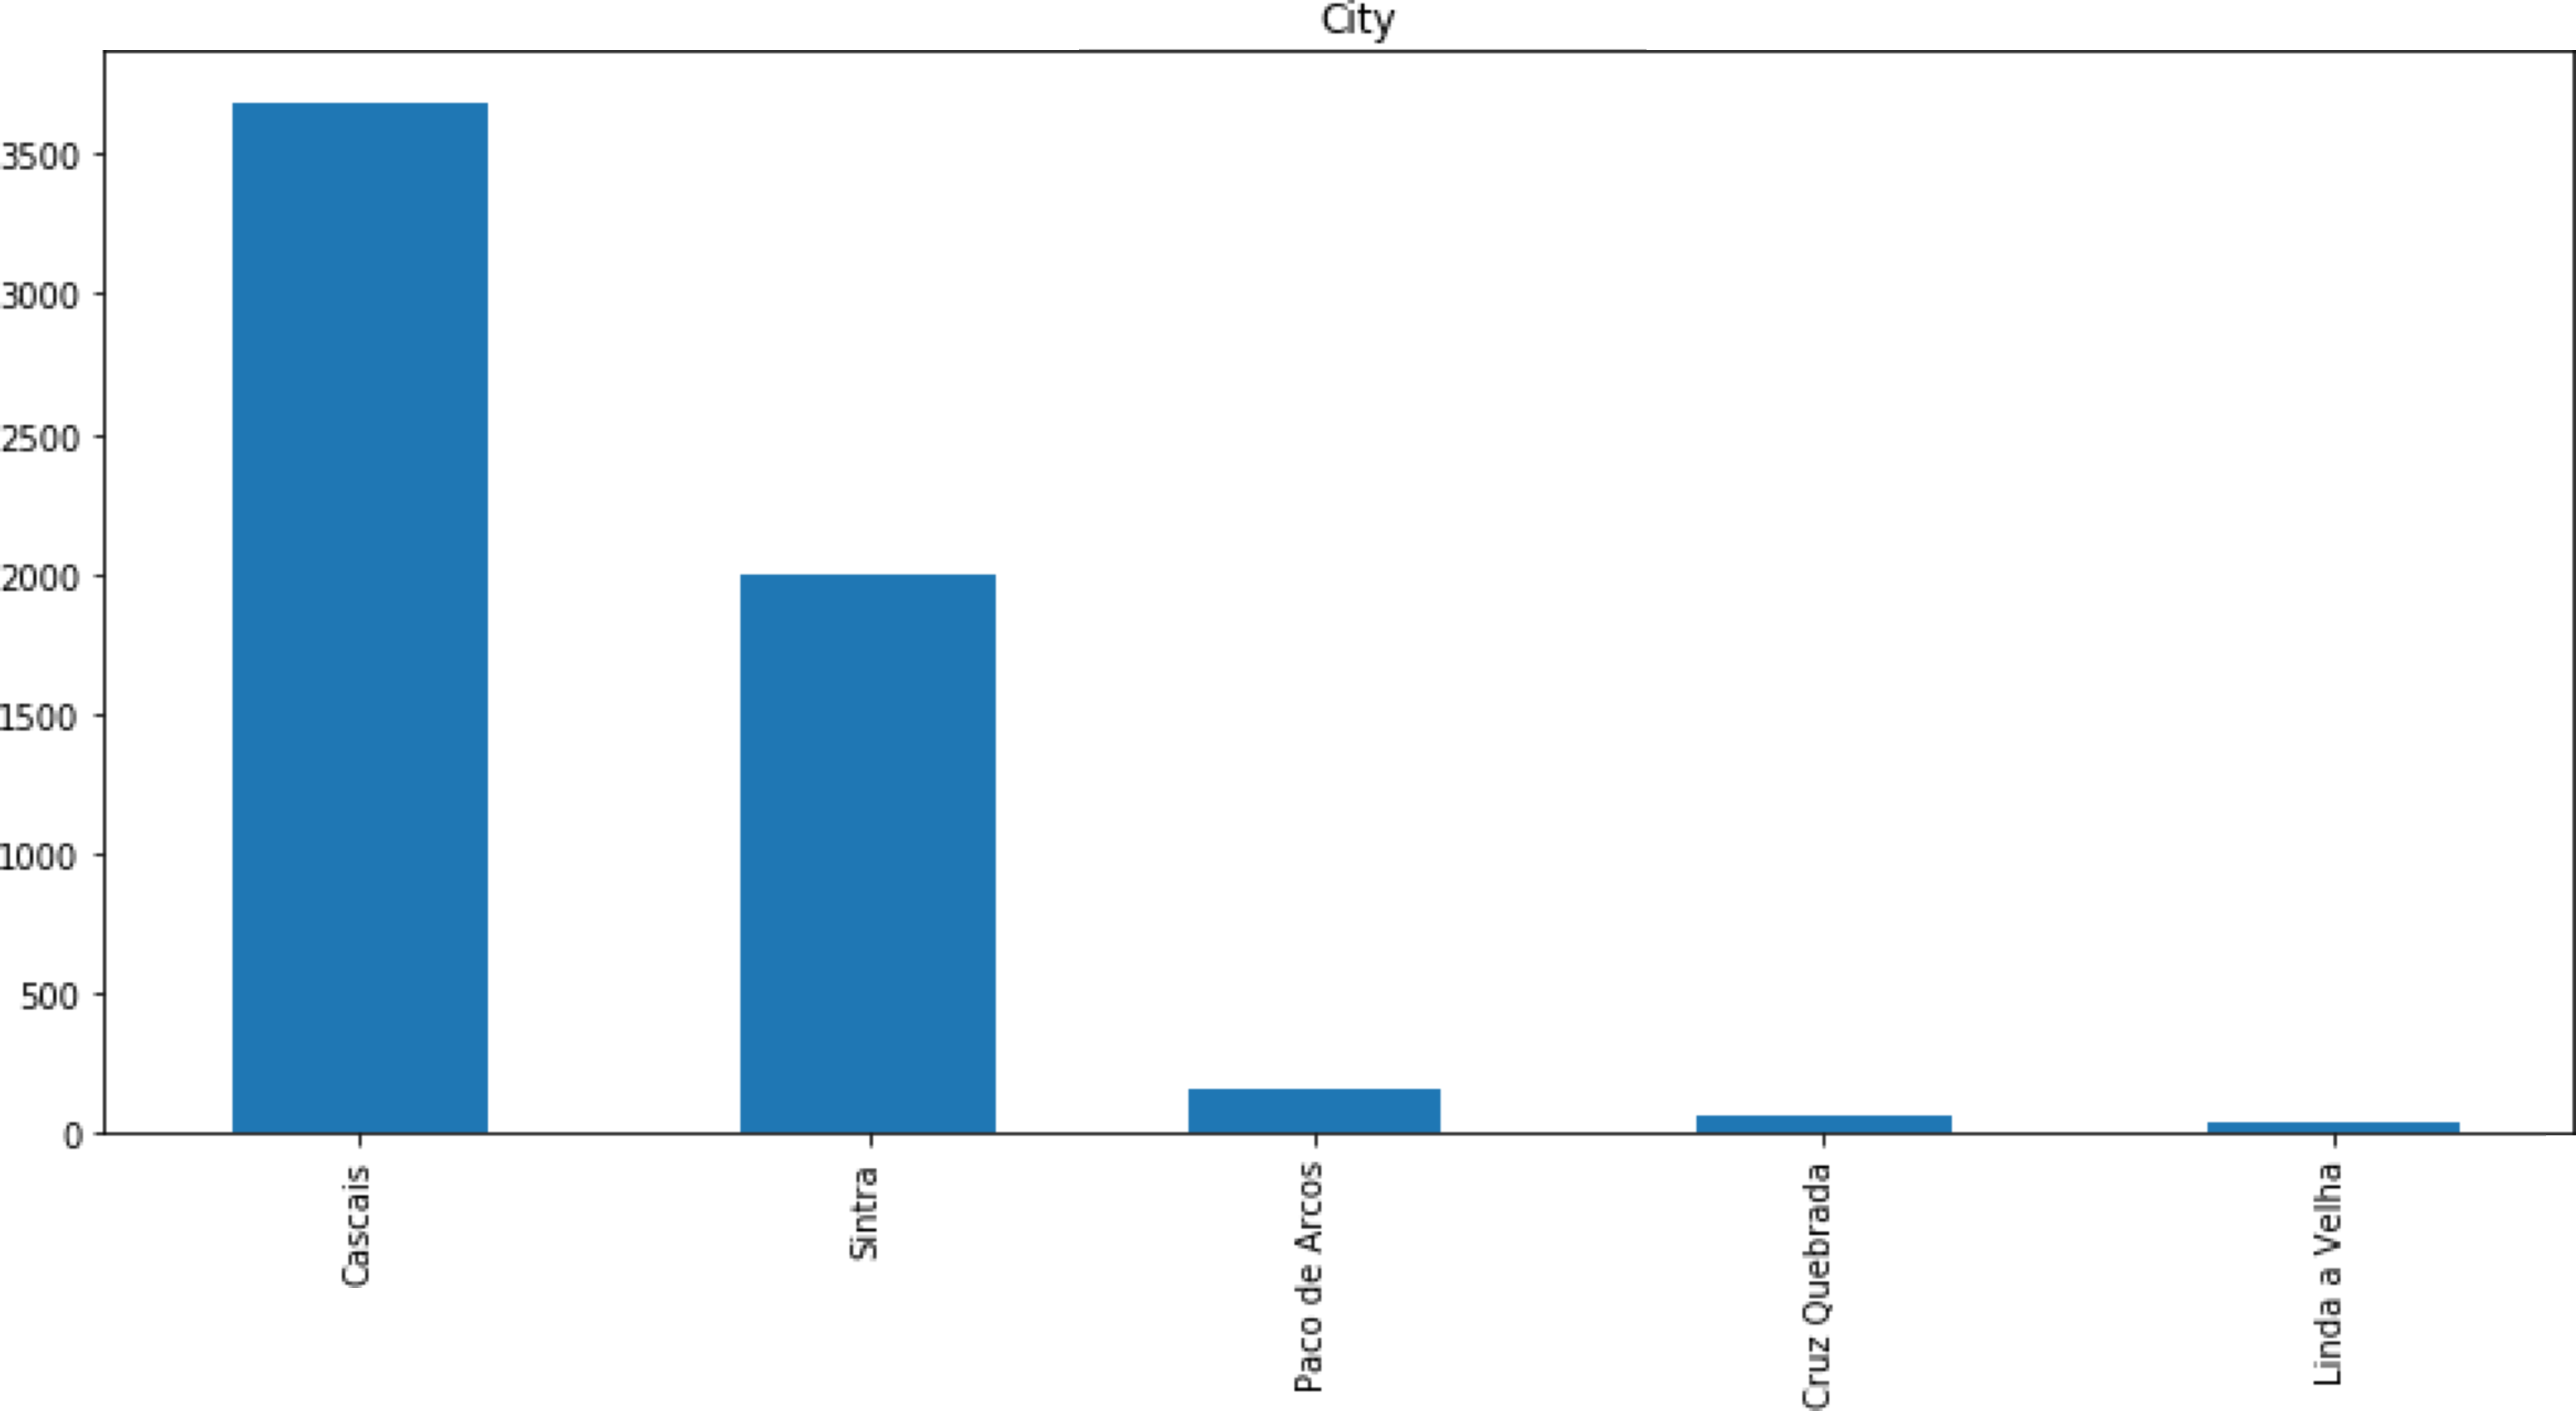
Below is depicted the geographical distribution of Airbnb listings:
Distribution of listings vary significantly across Municipalities:
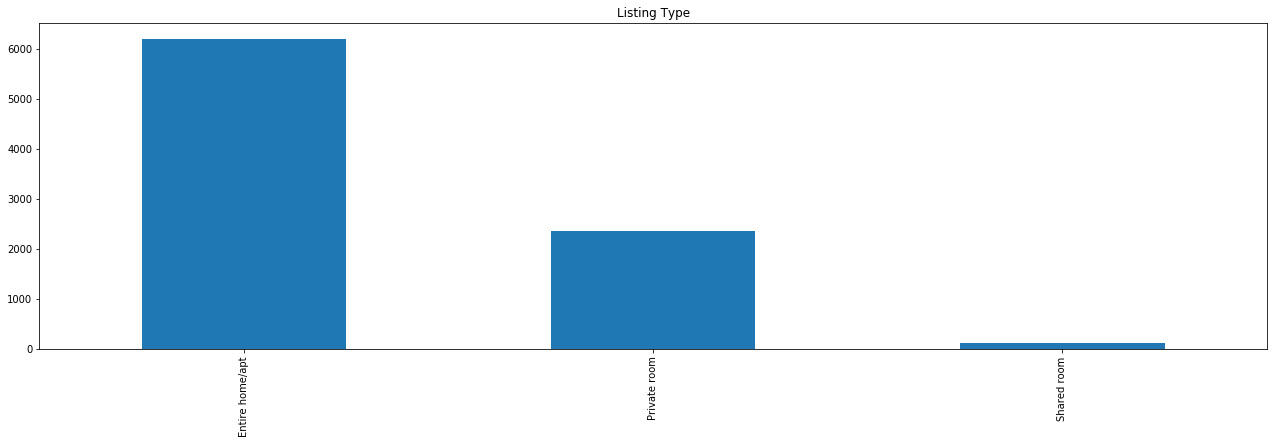
As seen below, most listings correspond to entire houmes/apartments.
Listing Reviews
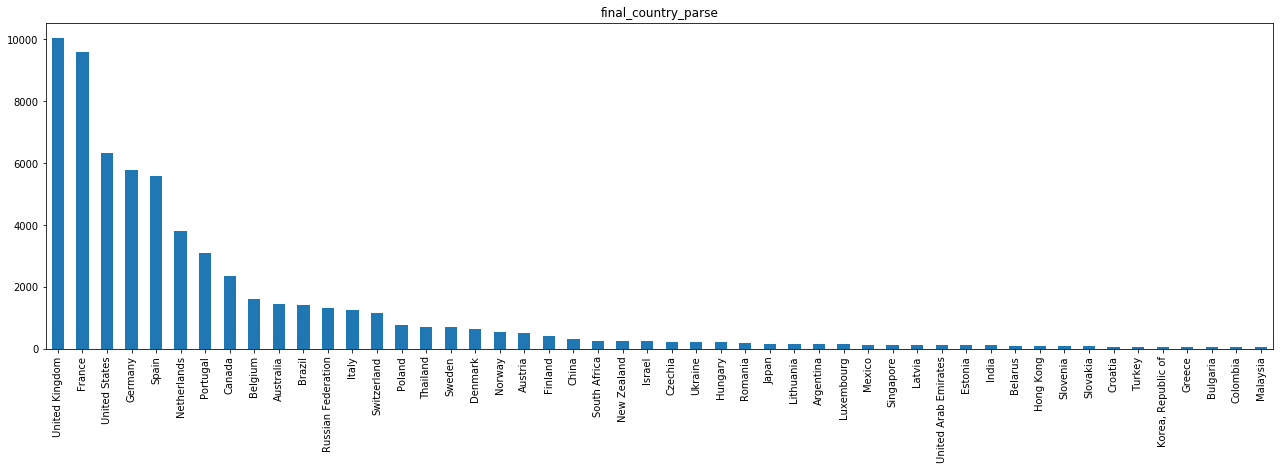
To extract information from this dataset some basic Text Mining techniques were required. This is because none of the data regarding user information is standardized. Although we have some details regarding the user's profile, namely its first name, country of origin, state (if applicable), city of origin, a brief user description, last attended teaching institution and occupation, none of it can be directly used for analysis without prior pre-processing (for the goal of this analysis, the priority was given to the parsing of the country of origin out of the non-standardized text fields: Country and City). This was done by developing a script to detect names of cities and countries out of these two variables. Then, the cities were associated to the corresponding country. Finally, the results from the two parsing processes were merged into a final solution. Out of approximately 1.2 million reviews’ country of origin, 118 thousand were left unparsed (i.e., unsuccessful parse). Finally, this is the top 50 countries of origin for tourists in Cascais:
Modelling
To analyse patterns in the data, we will start by segmenting Property Listings by geographic location and value. Afterwards, we will associate the generated clusters to the customer data and bookings data.
From the correlation matrix in the Listings table we can extract some insights regarding what can affect Airbnb listing value and assess which variables we should use for the value clustering:
Clustering
Geographic Clustering
We started by clustering listings geographically using the borders of each region in Cascais. To do this, we only used the variables Latitude and Longitude.
We will analyse the characteristics of these defined regions:
Value Clustering
We will use all variables that relate to the listing’s value as a tourism hosting, which in this case would be the Annual Revenue, Average Daily Rate, Occupancy Rate and Number of Bookings. The reason we did not pick the Number of Reviews for a listing is because it is highly correlated with the number of bookings. Hence, in order to avoid a bias in the clustering process, this variable was discarded.
The elbow method will be applied to determine the number of K:
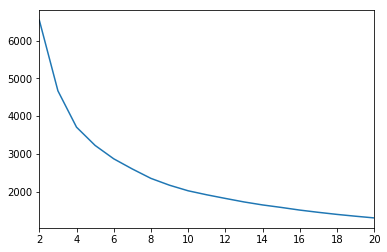
Along the increase of K, the decrease rate of inertia becomes lower when K=5. Considering the classification intuition behind value clustering (distinguish between high, medium-high, medium, medium-low and low value listings) 5 clusters will represent our preferred number of clusters.
Geographic Analysis
Cascais yields most of the number of reservations in the region, followed by Estoril and Colares:
Generated revenue distribution is somewhat similar to the number of reservations. Although, one can see that Colares generates nearly the same revenue as Estoril, even though it has less reservations:
One can now see that although Alcabideche generates little revenues and reservations, having also low occupancy rates (depicted below), it is the region with the highest revenue per reservation:
Average occupancy rate presents little variability across regions:
Unlike the remaining portuguese regions anaysed before, Cascais has a relatively similar country of origin distribution when compared to Faro, which means high representativity of users from the United Kingdom, Germany and France:
Length of stay varies little across region:
Country of Origin Analysis
Just like previously observed, there is a noticeable seasonality and heterogeneous visiting patterns:
Average Daily Rates vary greatly across countries of origin:
The average visitor renting an Airbnb in Cascais books the listing for a period of 3 to 5 days:
Value Analysis
Below is presented the weighted average daily rate for each region. The average daily rate was weighted using the number of reservations for each listing in each month. By doing this, we are attributing more weight to the houses with most listings, less weight to the ones with least listings and no weight to the ones without listings.
Finally, we calculated the ratio between Demand represented as the number of reservation, and supply, represented as the number of listings at each given period of time for each region. Additionally, in order to avoid a bias in the supply side, we filtered out listings with less than 5 listings in total, as these can either represent inactive listings or overly recent listings.